

Schema graph
See how an API's schemas refer to each other, and which operations use each one, as an interactive graph.
A schema is a named data model in an OpenAPI spec, such as Order or Customer. Schemas
live under components/schemas, and they point at each other with $ref links. An Order might
have a customer field that is a $ref to Customer.
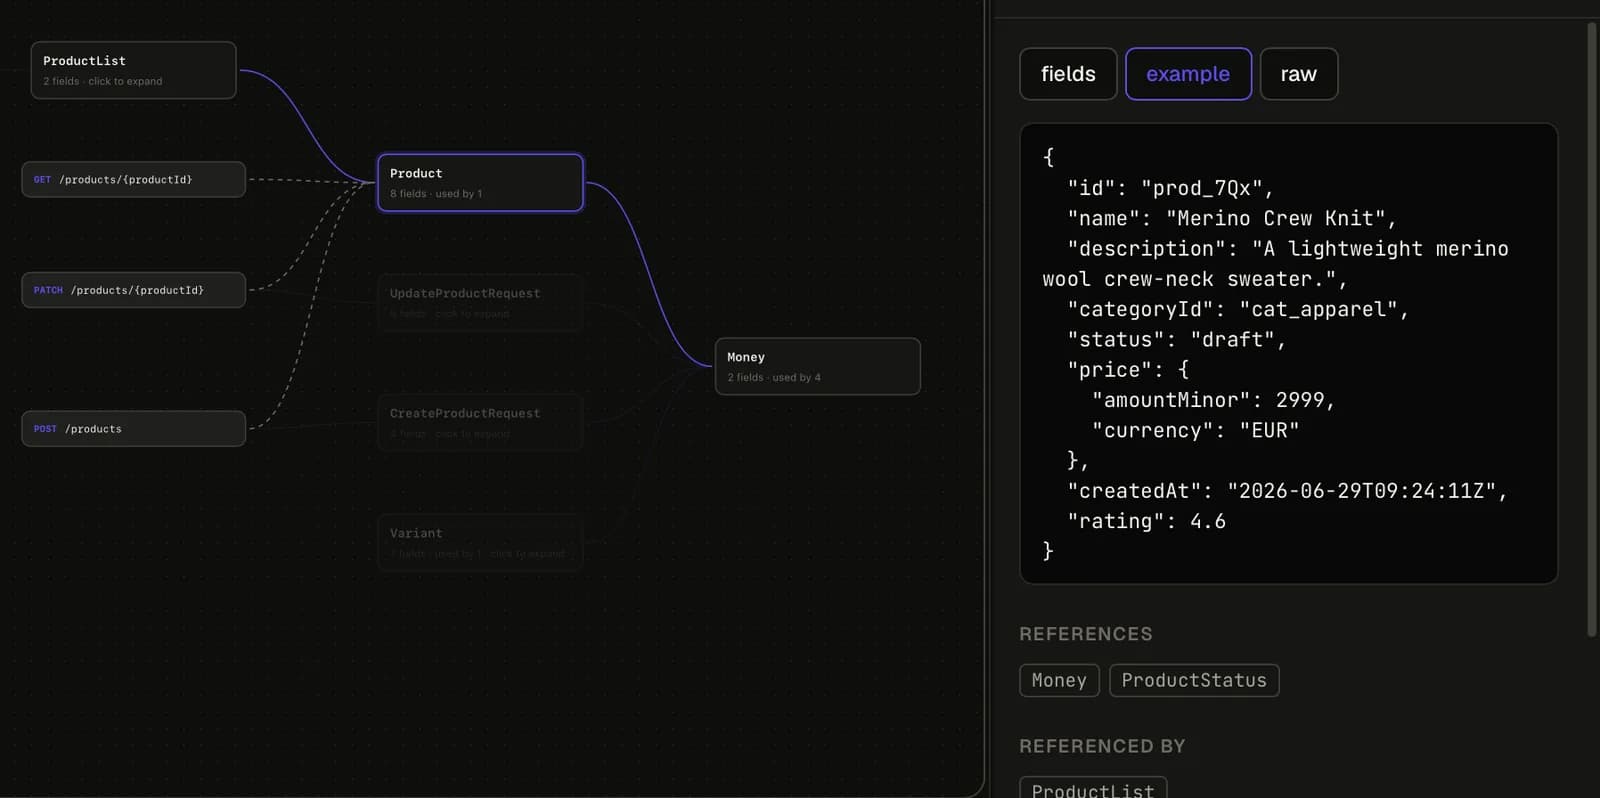
The schema graph draws those links. Each schema is a box, and each $ref is a line between two
boxes. You can also show the operations, with a line to each schema they use.
Opening the graph
Open an API from the APIs tab, then choose the Graph tab under the API's name. The shortcut
is ⌘3 (Ctrl+3 on Windows and Linux).
The graph uses the full width of the window. It works offline and needs no account, like the rest of the API views.
Moving around
The graph opens on the schema with the most links. It doesn't draw every schema at once, because a large spec can have hundreds.
- Click a schema to expand it. Its neighbours, the schemas it refers to and the schemas that refer to it, are added to the canvas.
- The side panel shows the schema you clicked: its fields, what it uses, what uses it, and an example. It is the same view as the Schemas tab. You can drag its edge to make it wider, or close it to give the canvas the whole window.
- Zoom and pan with the controls in the corner, your trackpad, or the mouse wheel.
When a schema has a lot of neighbours, the graph shows some of them and says how many there are in total. Click a neighbour to keep exploring from there.
Schemas that refer back to themselves, directly or through others (for example
Customer → Order → Customer), are marked as recursive. The graph doesn't follow them forever.
The toggles
Two checkboxes sit in the top-left corner of the canvas.
- Operations adds a box for each operation, such as
GET /orders/{orderId}, with a line to each schema it uses. It is off when the graph opens. - Simple types shows schemas that have no structure of their own: named strings, enums, and empty marker objects. They are hidden by default because they add a lot of boxes and not much meaning. This checkbox only appears when the spec has some. A simple type you click on is always shown.
When it's useful
- Learning a large spec. Start from the most-connected schema and follow the links. It is often quicker than reading the YAML top to bottom.
- Finding what a change affects. Before you change a schema, turn on Operations and click it. You see the schemas that include it and the operations that send or return it.
- Spotting recursive models. A model that refers back to itself is marked on the canvas, which is easy to miss in a file.
Limits
- Only
$reflinks to#/components/schemas/...in the same document become lines. A$refto another file or a URL is ignored. - The graph shows the spec as Studio holds it. It doesn't fetch anything.
The open-source library
The graph is built on @spec0/schema-graph, a small
MIT-licensed library. It reads an OpenAPI document and returns a plain data model of schemas,
operations and the links between them, with an optional React component that draws it. You can use
it in your own tools. It makes no network calls.
npm install @spec0/schema-graph